
Google Trends Unleashed
One of the greatest things about search engine marketing and Internet marketing in general is that you have tons of data to work with. You can tell how many people are clicking on your banner ads, how visitors are getting to your website, who those visitors are, and tons of other stuff that gives you feedback on how your marketing is doing. These days the amount and type of information at your disposal is growing every day. Keeping in line with this, Google released something called Google Trends to help you out even more. Google Trends isn’t just another analytic tool or website like Alexa, it offers some new information that could be groundbreaking for Internet marketers and marketing in general. Here are a few things that Google Trends can be used for.
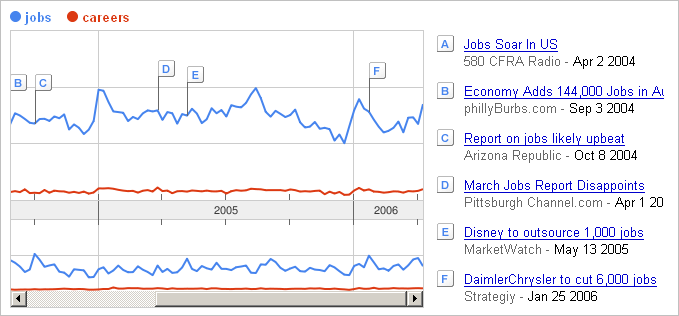
Google Trends gives you a graphical representation of search term volume. Not only can you tell which search terms are more popular, you can also see how they might be affected over time. On the outside this looks relatively simple, okay I’ll pick “Jobs” over careers. That might be a basic function here but I can imagine that by looking at how search term volume reacts to economic or other factors you might even get more information out of it. For example, if a search term for “flowers” is more responsive on Mothers day than “Roses”, then that could tell you a bit about how targeted those search terms are for selling flowers online.
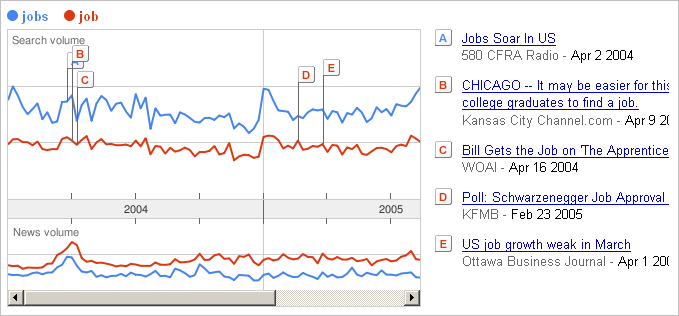
Google Trends will also show you the “form” of a search term that is more popular. If you are working on a PPC campaign, this might give you an idea of how you should change your bid for certain keyword forms. If “Jobs” is twice as popular as “Job” then you might want to take that into account and put more money on “Jobs” instead of “Job”. You can even go as far as spending twice as much money on the better form of the keyword to get its traffic while letting your competition pay more for the worse keyword.
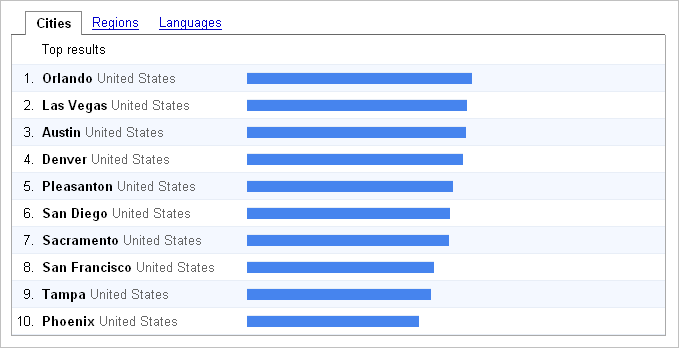
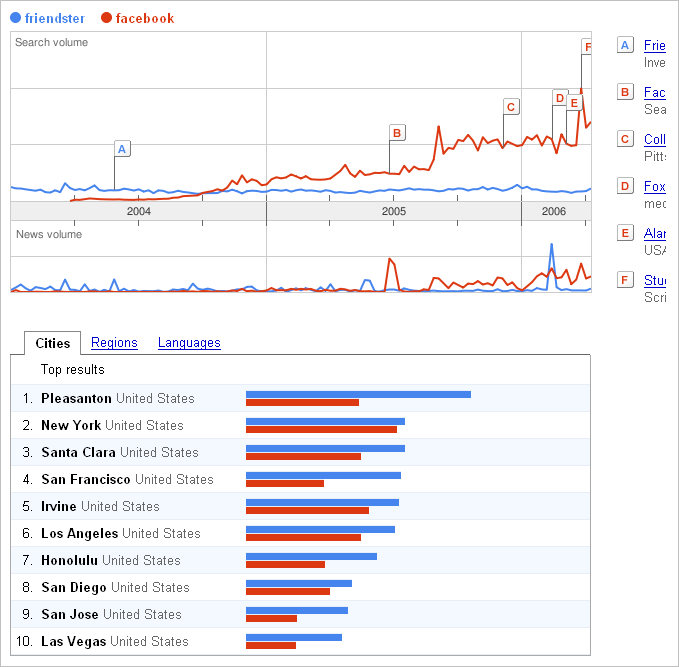
Google Trends gives you geotargeting data. This one blows me away because I’ve seen a ton of success with localizing search engine marketing campaigns. This tool gives you the ability to look at exactly where certain search terms are coming from. As a business, you could optimize your PPC campaigns to hit the geographical locations that will get you the most traffic. Taking this further, you could even use this information to get an idea of how successful you are in some areas versus others. If your traffic from one geographical area is low yet you see from this chart that there are a ton of searches from that location, there might be a problem. Take a closer look at your PPC campaigns, competition in those areas, and anything else that might give you an idea what is going on. That would give you a clear indication of what you can do to make a big impact with your marketing dollars. Overall, this can give you an idea of market opportunity by geography.
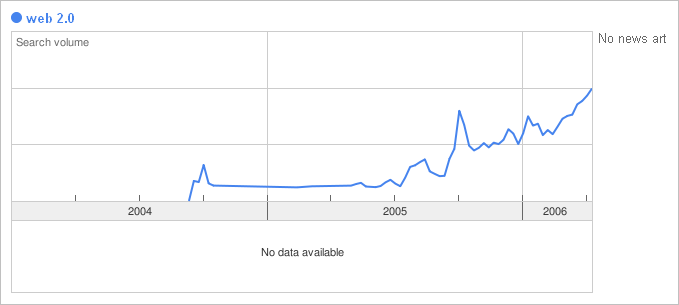
Taking another look at market opportunity, Google Trends shows you how much a space is growing. We all know the web 2.0 space is taking off, but by how much? This lets you see the growth rate of specific search terms and the industry in general. Or it can show you if an industry or a space peaks at certain times of the year, such as December for ecommerce products. You can get some idea of how your business is faring with this sort of thing. Suppose there was a large jump during the holiday season for your search terms, yet you didn’t see a corresponding growth percentage. Perhaps your competition stepped it up at this point or you didn’t include things like holiday specials, holiday-specific pages, or anything else that could have kept you in tune with the buyers. Overall, this is another indicator that can be used to see how you are doing compared to your competition or the market in general.
This feature gives you a clear idea of how you are doing compared to the competition overall and by geography. You can take a look at this and get an idea of how effective your marketing is, especially after ramping up some online marketing campaigns, webpage redesign/realign, or anything else you do to improve. You can also look at results of localized marketing campaigns (offline or online) and see what kind of impact you had. Did your new campaign help you gain ground on your competition or maintain your lead? Taking a look at a graph like this can really help you get an idea of how you are doing. Often, growth can be misconstrued as a direct result of marketing. The thing to keep in mind is that growth should be normalized to overall industry growth for you to tell how well you are doing. If the overall industry is growing, but your competitors are growing faster then you should be careful. That would lead to a loss in market share and things like this should be headed off as quickly as possible. The same exact thing could be said when you break it down by geography.
Overall, Google Trends gives you more than meets the eye when it comes to market analysis. The basic features and obvious uses for this tool make it very nice to have. If you take these tools further and really look at what the indicators mean and get creative with your analysis, this tool would quickly become invaluable.
One thing that I haven’t pointed out yet is the fact that this is all qualitative information, not quantitative. That being said, I really don’t think it matters. You will be looking for relative trends anyhow, and numbers could actually throw you off if you aren’t careful. Taking all this into account, I’d say that this tool could quickly become a must-have in your marketing toolbox.
Enjoy the post? Here are some more that may interest you.

Trackbacks (0)
There are no trackbacks for this post yet.


 | RSS Feed
Reader Comments (0)
There are no comments for this post yet.